Fractal is a term coined in
1975 by fractal geometry's founder, Benoit Mandelbrot. He took it from
the Latin word “fractus”, meaning broken. Fractals are geometric images
that are self-similar at all scales, infinitely precise and describe
nature. Fractals are graphed using very simple formulas that are
iterated over and over on a complex plane. The result is very
complicated images, which repeat themselves as you zoom in on it. These
cannot be created using classical geometry.
The definition of a fractal is
very strange. To understand it you need to know what self-similarity is,
what makes something infinitely precise, and why this describes nature.
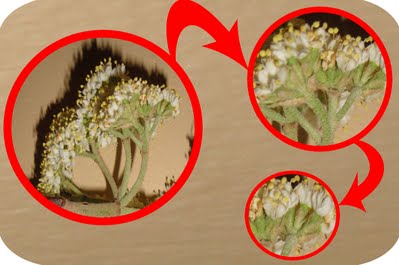
If you look at the M set you
see the beetle-like heart shape. As you zoom in you find this shape
again, and again, and again. The figure reappears within itself.
Fractals repeat over and over like this, and like nature does. For
instance if you look at a cloud, it looks like itself if you zoom in
closer at the cloud. Nature and fractals are self-similar.
 Fractals are infinitely
precise. As you zoom in on the M set you find that the black-beetle
shape has many ridges, and corners. The border of the M set is infinite.
You will always be able to find more, and rougher edges that seem
imposable to measure. Like in nature, you cannot measure the surface
area of a tree. This is because you will have to measure each ridge of
the tree, and each dent on each ridge, and each rough edge of each dent,
and so on. Fractals are needed to measure something that is infinitely
precise like nature.
Fractals are infinitely
precise. As you zoom in on the M set you find that the black-beetle
shape has many ridges, and corners. The border of the M set is infinite.
You will always be able to find more, and rougher edges that seem
imposable to measure. Like in nature, you cannot measure the surface
area of a tree. This is because you will have to measure each ridge of
the tree, and each dent on each ridge, and each rough edge of each dent,
and so on. Fractals are needed to measure something that is infinitely
precise like nature.
To know how they are graphed
you need to understand the complex plane. A complex plane is like a
coordinate plane, but the “y” axis is called the imaginary axis, and the
“x” axis is called the real axis. On the imaginary axis are plotted all
the imaginary numbers. So in the formula c=6+2i,
point c would be found +6 places on the real axis and +2 places on the
imaginary axis. (See animation below)
The complex plane allows the M
Set to be graphed. Using the formula z1=z2+c
Mandelbrot created his set. He put the formula into a computer, iterated
it over and over, and graphed each point on a complex plane. The result
is an image made entirely of points, that are infinitely precise,
self-similar at all scales, and describes nature.
The points in the M Set are
all black. This is because those points are finite, meaning when “c” is
put back into the equation it oscillates. The colored points that wrap
around the M Set do not belong to the M Set. They are infinite, meaning
that when “c” is put back into the formula the results keep getting
larger. They are colored based off of how fast they move towards
infinity.
Fractal geometry’s purpose is
to use numbers to accurately describe nature. Fractals do this using
fractal dimension. One dimension is the strait line, two dimensions is a
plane, and three dimensions is a cube. Fractal dimension is between one,
two, and three. Nature is measured using fractal dimension. For example
the coastline of Britain is 1.25.
There are two to find fractal
dimension. One is difficult and the other is simpler. The easier method
is called “box counting.” It even sounds simple.
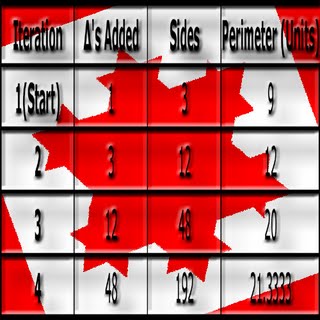
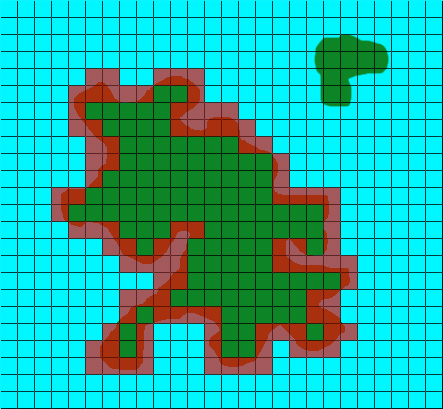
To use “box counting” first
you take a fractal curve, such as a coastline, and you place a grid on
top of it. Then count all the boxes that the curve goes through. (Lets
say you count 27 boxes) Then you take a smaller grid and place that over
the curve and count the boxes again. (Lets say you count 60 boxes) Then
you plug them into a formula.
log (length increase)/ log (scale factor)
log(44)
/
log(4)
2.72971581…